Runkeeper heatmaps
This morning my friend Walter sent me a link to his cycling heat map on Strava, and it was pretty cool. Even cooler than my silly temperature + Fitbit history chart maker app, Weatherbit ![]() .
.
Update: Check out an example map from CityStrides.

Walter's cycling heat map
I figured there must be a web service that creates these based on Runkeeper data, so I Googled “runkeeper heatmap.”

Apparently there isn’t a ready made service, but the top result gave me exactly what I needed to do it myself. After I finished work today, I read over Bruno Sánchez-A Nuño‘s blog from 2012, “A heatmap for all your runs in RunKeeper,” and within no time I was making heat maps!
Technically, this method isn’t so much of a heat map as it is adding layers of strokes to track line. Bruno faked the “heat” by using translucent colors, which layered to form more opaque colors. Without more sophisticated rules to work with, I struggled to replicate the Strava look, and eventually just started messing around till I got tired. I’m happy enough with the colors to go to bed now, but I certainly wouldn’t call it my best work… though Bruno apparently has a PhD in astrophysics and worked at Mapbox, so I don’t feel so bad.
Anyway, here are my results and some notes on how I set it up. I’ll include screenshots as well as the Mapbox widget, in case Mapbox or my blog go out of service sometime in the future. Oh, wait…
TileMill + Mapbox heat maps
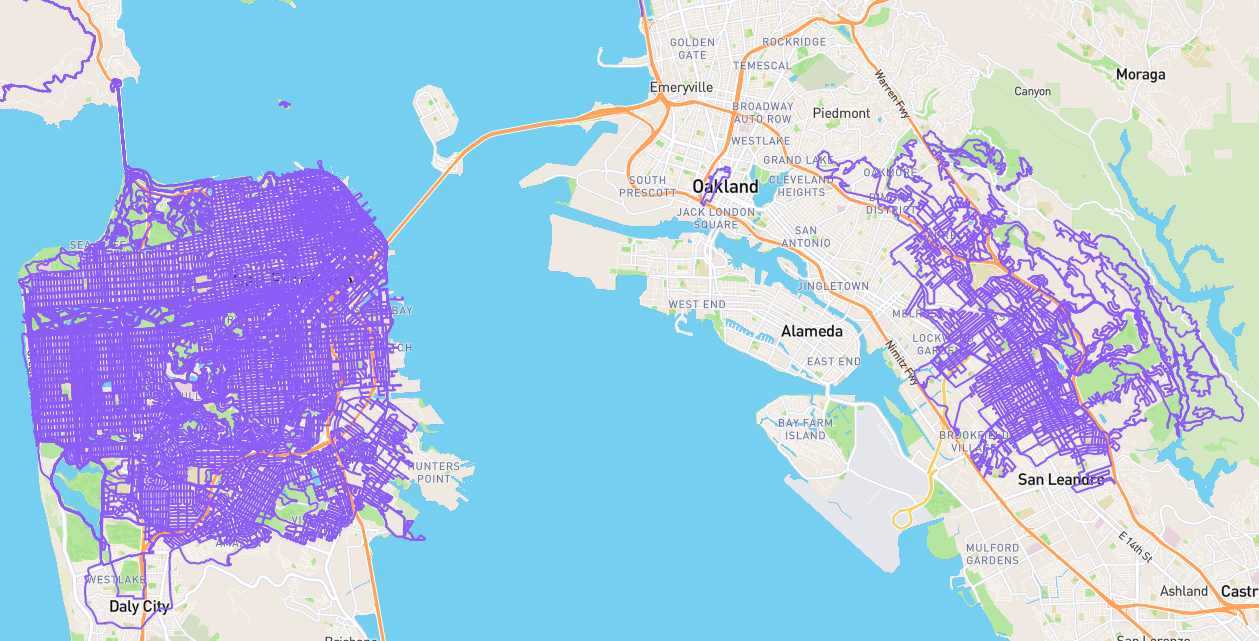
San Francisco (view on Mapbox)

Running heat map: San Francisco, California
Milwaukee (view on Mapbox)

Running heat map: Milwaukee, Wisconsin
Madison, Wisconsin
Here’s the screenshot, but this track is actually part of the Milwaukee map above if you scroll west far enough!

Running heat map: Madison, Wisconsin
Setup notes
[COLLAPSE]
I followed the instructions at “A heatmap for all your runs in RunKeeper,” but here is a brief summary in case that link breaks. Read his blog for more details and some stuff I left out, such as track hover text.
-
Figure out what the heck
ogr2ogris by confirming I don’t have it, and then googling.➜ ~ which ogr2ogr ogr2ogr not foundGoogle “ogr2ogr OSX” and find “Where do I find the ogr2ogr command for Mac OS X Lion?,” yielding the knowledge this is part of GDAL and I can get it by running the command
brew install gdal. Note this assumes you have Homebrew installed already. -
Install GDAL and confirm
ogr2ogrshowed up.➜ ~ brew install gdal ==> Installing dependencies for gdal: giflib, libtiff, lzlib, proj, libge ==> Installing gdal dependency: giflib ==> Downloading https://homebrew.bintray.com/bottles/giflib-4.2.3.yosemite.bottl … ~ which ogr2ogr /usr/local/bin/ogr2ogr -
Download my Runkeeper history.
-
Run Bruno’s suggested command to make the shape file. Note I got a bunch of errors below, but I just ignored them and forged on, intending to go back and troubleshoot if my map was crap.
➜ ~ cd ~/Desktop/ ➜ Desktop directory=runkeeper-data-export-1545992-2015-11-03-0641/ ➜ Desktop for file in $( ls $directory ) for> do for> ogr2ogr -append runs $directory$file for> done Warning 6: Field time create as date field, though DateTime requested. Warning 6: Normalized/laundered field name: 'geoidheight' to 'geoidheigh' Warning 6: Normalized/laundered field name: 'ageofdgpsdata' to 'ageofdgpsd' Warning 6: Normalized/laundered field name: 'route_point_id' to 'route_poin' Warning 6: Field time create as date field, though DateTime requested. Warning 6: Normalized/laundered field name: 'geoidheight' to 'geoidheigh' Warning 6: Normalized/laundered field name: 'ageofdgpsdata' to 'ageofdgpsd' Warning 6: Normalized/laundered field name: 'track_seg_id' to 'track_seg_' Warning 6: Normalized/laundered field name: 'track_seg_point_id' to 'track_se_1' Warning 6: Field time create as date field, though DateTime requested. Warning 6: Normalized/laundered field name: 'geoidheight' to 'geoidheigh' Warning 6: Normalized/laundered field name: 'ageofdgpsdata' to 'ageofdgpsd' ERROR 1: XML parsing of GPX file failed : mismatched tag at line 404, column 2 ERROR 1: XML parsing of GPX file failed : mismatched tag at line 404, column 2 ERROR 1: XML parsing of GPX file failed : mismatched tag at line 404, column 2 ERROR 1: XML parsing of GPX file failed : mismatched tag at line 404, column 2 ERROR 1: XML parsing of GPX file failed : mismatched tag at line 404, column 2 ERROR 1: XML parsing of GPX file failed : mismatched tag at line 104, column 2 ERROR 1: XML parsing of GPX file failed : mismatched tag at line 104, column 2 ERROR 1: XML parsing of GPX file failed : mismatched tag at line 104, column 2 ERROR 1: XML parsing of GPX file failed : mismatched tag at line 104, column 2 ERROR 1: XML parsing of GPX file failed : mismatched tag at line 104, column 2 ERROR 1: XML parsing of GPX file failed : mismatched tag at line 344, column 2 ERROR 1: XML parsing of GPX file failed : mismatched tag at line 344, column 2 ERROR 1: XML parsing of GPX file failed : mismatched tag at line 344, column 2 ERROR 1: XML parsing of GPX file failed : mismatched tag at line 344, column 2 ERROR 1: XML parsing of GPX file failed : mismatched tag at line 344, column 2 -
Download TileMill and create a new project with no base map layer or styles, and add a layer form the lower right layers menu. For the datasource, select the
tracks.shpfile from therunsfolder theogr2ogrcommand created on your desktop, or wherever you ran the command. -
Have fun styling. My styles were pretty crap, but here they are:
#tracks::extraglow[zoom <8] { line-width:5; line-color:#0c7205; line-opacity:1; line-smooth:0; } #tracks::extraglow[zoom >8] { line-width:10; line-color:#0000ff; line-opacity:0.25; line-smooth:0.5; } #tracks::glow[zoom <8] { line-width:0; } #tracks::glow[zoom >8] { line-width:7; line-color:#ff0000; line-opacity:0.05; } #tracks::base { line-width:2; line-color:#ff0000; line-opacity:0.33; } -
Export to Mapbox from within TileMill.
- Make a Mapbox project, and add the exported map by going to Data > menu icon > Layers > Add/remove layers.
[/COLLAPSE]
QGIS heat map
After a little more research, I found an article “Designing heat maps” in Mapbox’s documentation, and with those pointers I was able to create a “real” heat map using QGIS. I saved that page as a PDF, since the following is based on that, and software documentation has a way of disappearing into the abyss.
Instead of the tracks.shp file used with TileMill, I imported the track_points.shp file as a new layer in QGIS. Mapbox’s tutorial mentioned to go to Raster > Heatmap > Heatmap, but I couldn’t get that process to work. I tried the default values, as well as matching what were apparently the defaults in Mapbox’s screenshot (Buffer Radius 10, Decay Ratio 0.5), but both times it took 30 minutes to generate a weird, small TIFF file. I was unable to continue following the tutorial, for when I selected “Pseudocolor” as suggested, the layer seemed to become invisible.
But then I tried doing the same process to the imported track_points layer itself, and that worked! I just right clicked the track_points layer, selected Properties, and from the already selected Style tab’s top left drop down menu, I chose “Heatmap”. I then played with the colors and radius and maximum value a bit. The automatic maximum was cool, but most of the map was very dim because most of my runs passed a particular street, so there was a huge spread between max and min with most points heavily skewed toward the min.

QGIS layer properties that generated heat map from track log points
Here are the results of that one:

My real San Francisco running heat map
Then I worked on the color thresholds a bit more. At first I wanted to emulate a map with paths indicating where I’ve been, but it wasn’t looking cool enough with just darker browns, so I added the red-orange-yellow thing again. Here’s the layer settings and result:

QGIS layer properties that generated heat map from track log points

My real San Francisco running heat map, Take 2
QGIS installation notes
[COLLAPSE]
- QGIS 2.12.0-1 from QGIS
- Requires GDAL 1.11 Complete, different than the previously installed GDAL P
- Requires Matplotlib Python module, www.kyngchaos.com build, but was able to install dependencies with below command first, then install www.kyngchaos.com build on top.
Installing matplotlib:
➜  ~  which pip
/usr/local/bin/pip
➜  ~  pip install matplotlib
Requirement already satisfied (use --upgrade to upgrade): matplotlib in /System/Library/Frameworks/Python.framework/Versions/2.7/Extras/lib/python
Requirement already satisfied (use --upgrade to upgrade): numpy>=1.5 in /System/Library/Frameworks/Python.framework/Versions/2.7/Extras/lib/python (from matplotlib)
Requirement already satisfied (use --upgrade to upgrade): python-dateutil in /System/Library/Frameworks/Python.framework/Versions/2.7/Extras/lib/python (from matplotlib)
Collecting tornado (from matplotlib)
  Downloading tornado-4.2.1.tar.gz (434kB)
    100% |████████████████████████████████| 438kB 859kB/s
Requirement already satisfied (use --upgrade to upgrade): pyparsing>=1.5.6 in /System/Library/Frameworks/Python.framework/Versions/2.7/Extras/lib/python (from matplotlib)
Collecting nose (from matplotlib)
  Downloading nose-1.3.7-py2-none-any.whl (154kB)
    100% |████████████████████████████████| 155kB 1.0MB/s
Collecting backports.ssl-match-hostname (from tornado->matplotlib)
  Downloading backports.ssl_match_hostname-3.4.0.2.tar.gz
Collecting certifi (from tornado->matplotlib)
  Downloading certifi-2015.9.6.2-py2.py3-none-any.whl (371kB)
    100% |████████████████████████████████| 372kB 1.1MB/s
Installing collected packages: backports.ssl-match-hostname, certifi, tornado, nose
  Running setup.py install for backports.ssl-match-hostname
    Complete output from command /usr/bin/python -c "import setuptools, tokenize;__file__='/private/var/folders/3t/v9mt63mn4m39hmdjj4d3sc540000gp/T/pip-build-smH5RR/backports.ssl-match-hostname/setup.py';exec(compile(getattr(tokenize, 'open', open)(__file__).read().replace('\r\n', '\n'), __file__, 'exec'))" install --record /var/folders/3t/v9mt63mn4m39hmdjj4d3sc540000gp/T/pip-RMn7fV-record/install-record.txt --single-version-externally-managed --compile:
    running install
    running build
    running build_py
    creating build
    creating build/lib
    creating build/lib/backports
    copying src/backports/__init__.py -> build/lib/backports
    creating build/lib/backports/ssl_match_hostname
    copying src/backports/ssl_match_hostname/__init__.py -> build/lib/backports/ssl_match_hostname
    running egg_info
    writing src/backports.ssl_match_hostname.egg-info/PKG-INFO
    writing top-level names to src/backports.ssl_match_hostname.egg-info/top_level.txt
    writing dependency_links to src/backports.ssl_match_hostname.egg-info/dependency_links.txt
    warning: manifest_maker: standard file '-c' not found

    reading manifest file 'src/backports.ssl_match_hostname.egg-info/SOURCES.txt'
    reading manifest template 'MANIFEST.in'
    writing manifest file 'src/backports.ssl_match_hostname.egg-info/SOURCES.txt'
    copying src/backports/ssl_match_hostname/LICENSE.txt -> build/lib/backports/ssl_match_hostname
    copying src/backports/ssl_match_hostname/README.txt -> build/lib/backports/ssl_match_hostname
    running install_lib
    creating /Library/Python/2.7/site-packages/backports
    error: could not create '/Library/Python/2.7/site-packages/backports': Permission denied

    ----------------------------------------
Command "/usr/bin/python -c "import setuptools, tokenize;__file__='/private/var/folders/3t/v9mt63mn4m39hmdjj4d3sc540000gp/T/pip-build-smH5RR/backports.ssl-match-hostname/setup.py';exec(compile(getattr(tokenize, 'open', open)(__file__).read().replace('\r\n', '\n'), __file__, 'exec'))" install --record /var/folders/3t/v9mt63mn4m39hmdjj4d3sc540000gp/T/pip-RMn7fV-record/install-record.txt --single-version-externally-managed --compile" failed with error code 1 in /private/var/folders/3t/v9mt63mn4m39hmdjj4d3sc540000gp/T/pip-build-smH5RR/backports.ssl-match-hostname
➜  ~  sudo pip install matplotlib
The directory '/Users/cgorichanaz/Library/Caches/pip/http' or its parent directory is not owned by the current user and the cache has been disabled. Please check the permissions and owner of that directory. If executing pip with sudo, you may want sudo's -H flag.
The directory '/Users/cgorichanaz/Library/Caches/pip' or its parent directory is not owned by the current user and caching wheels has been disabled. check the permissions and owner of that directory. If executing pip with sudo, you may want sudo's -H flag.
Requirement already satisfied (use --upgrade to upgrade): matplotlib in /System/Library/Frameworks/Python.framework/Versions/2.7/Extras/lib/python
Requirement already satisfied (use --upgrade to upgrade): numpy>=1.5 in /System/Library/Frameworks/Python.framework/Versions/2.7/Extras/lib/python (from matplotlib)
Requirement already satisfied (use --upgrade to upgrade): python-dateutil in /System/Library/Frameworks/Python.framework/Versions/2.7/Extras/lib/python (from matplotlib)
Collecting tornado (from matplotlib)
  Downloading tornado-4.2.1.tar.gz (434kB)
    100% |████████████████████████████████| 438kB 693kB/s
Requirement already satisfied (use --upgrade to upgrade): pyparsing>=1.5.6 in /System/Library/Frameworks/Python.framework/Versions/2.7/Extras/lib/python (from matplotlib)
Collecting nose (from matplotlib)
  Downloading nose-1.3.7-py2-none-any.whl (154kB)
    100% |████████████████████████████████| 155kB 2.4MB/s
Collecting backports.ssl-match-hostname (from tornado->matplotlib)
  Downloading backports.ssl_match_hostname-3.4.0.2.tar.gz
Collecting certifi (from tornado->matplotlib)
  Downloading certifi-2015.9.6.2-py2.py3-none-any.whl (371kB)
    100% |████████████████████████████████| 372kB 969kB/s
Installing collected packages: backports.ssl-match-hostname, certifi, tornado, nose
  Running setup.py install for backports.ssl-match-hostname
  Running setup.py install for tornado
Successfully installed backports.ssl-match-hostname-3.4.0.2 certifi-2015.9.6.2 nose-1.3.7 tornado-4.2.1
[/COLLAPSE]
Craving more?
If you think that’s cool but don’t want to spend the effort, and you happen to have a Fitbit, you might be interested in the aforementioned silly weather fitness chart thing I made. Weatherbit shows you a chart of your step count history graphed against the daily temperature. Woo!

See how the weather affects your activity level with Weatherbit.