Runkeeper’s paid charts still aren’t working
I started using Runkeeper to track my runs in July 2010, and soon after I started paying $19.99 per year to support the service. The additional features for the money were limited, basically boiling down to some extra charts and a live run feature where others can see your run in real time. This wasn’t as cool as it could be, or even as similar features from competitors. I’ve seen friends using a Nike app, I think, where it would post to Facebook at the start of a run, and the phone would read comments and cheers as friends interacted with the post. As far as I know, Runkeeper never did anything like that. And I’m not sure I would have used it anyway.
But over the years, I have started to care more about the charts, as I get more data under my belt. Runkeeper has also started charging more. I paid $20 a year from 2011 to 2013, and then $40 a year in 2014 and 2015. That’s $139.95 so far. At the beginning I was happy to support what was a leading but small app. Now it’s a larger community, and there aremany similar apps, so I’ve cared more about what I am getting for the money. Most importantly, I’ve wanted to see my weight history compared to my running history. This never worked well on Runkeeper, but I also never complained. I figured it would be fixed soon. But now years later, I finally decided to contact Runkeeper about it. It seems to be a “known issue”, and I was told they are working on it. But it also seems unlikely I would have contacted them after years at just the moment they started working on it.
Here’s the graph I want to see, my lifetime graph, but the weight stops abruptly:
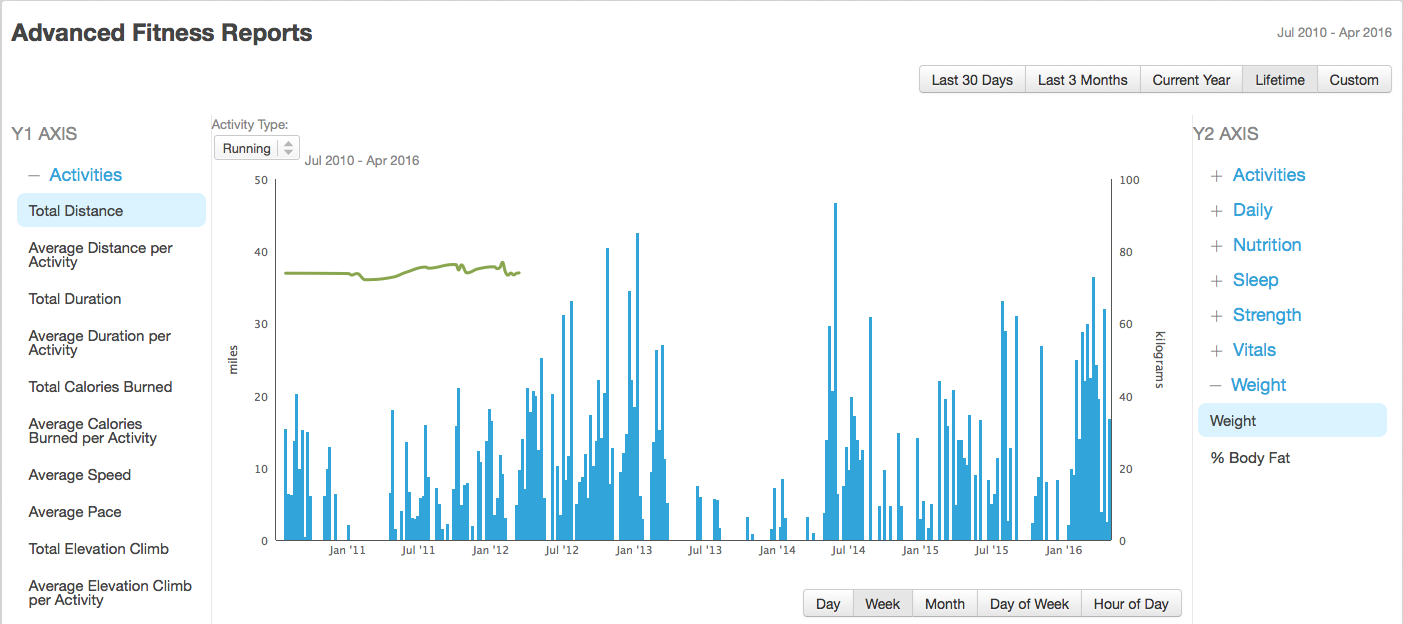
runkeeper_201007-201602_weekly.png
If I change it to show by day instead of by week, the weights suddenly work all the way across, but the running disappears:
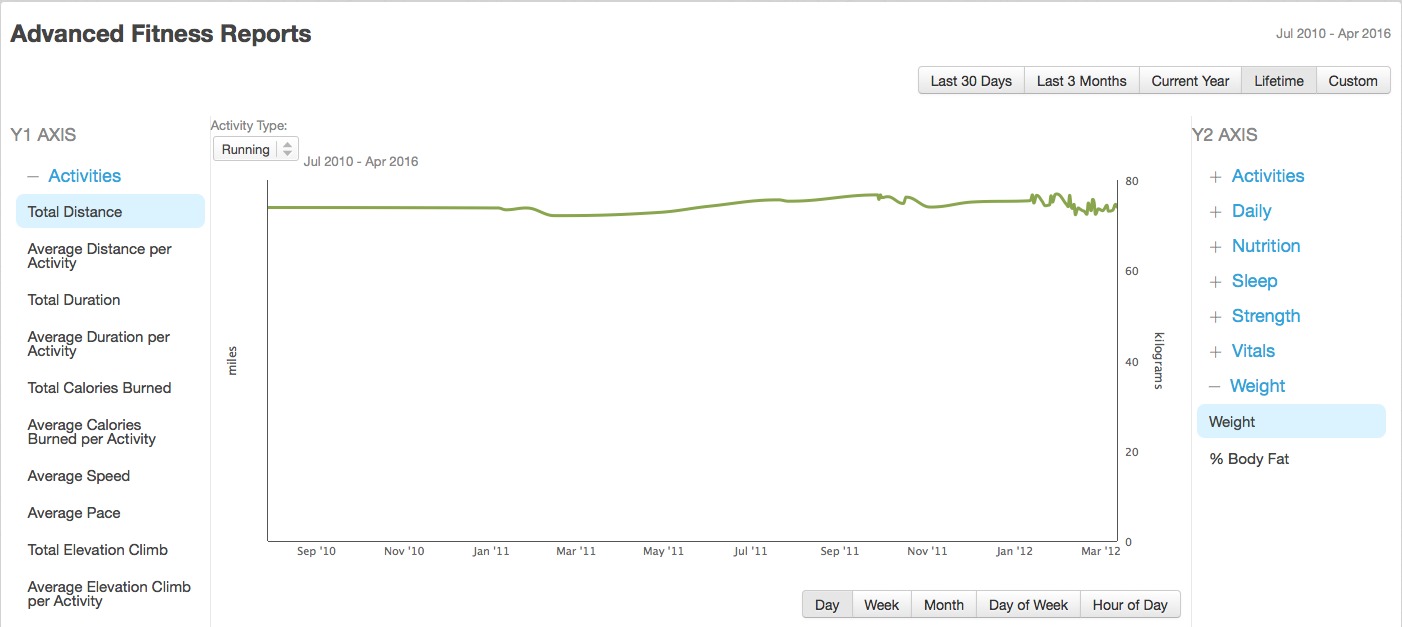
runkeeper_201007-201602_daily.png
For now, I’ve been looking at my weight history, and also body fat composition history, directly on Withings’s Health mate site, since I use their scale. At least that lets me see my full history.
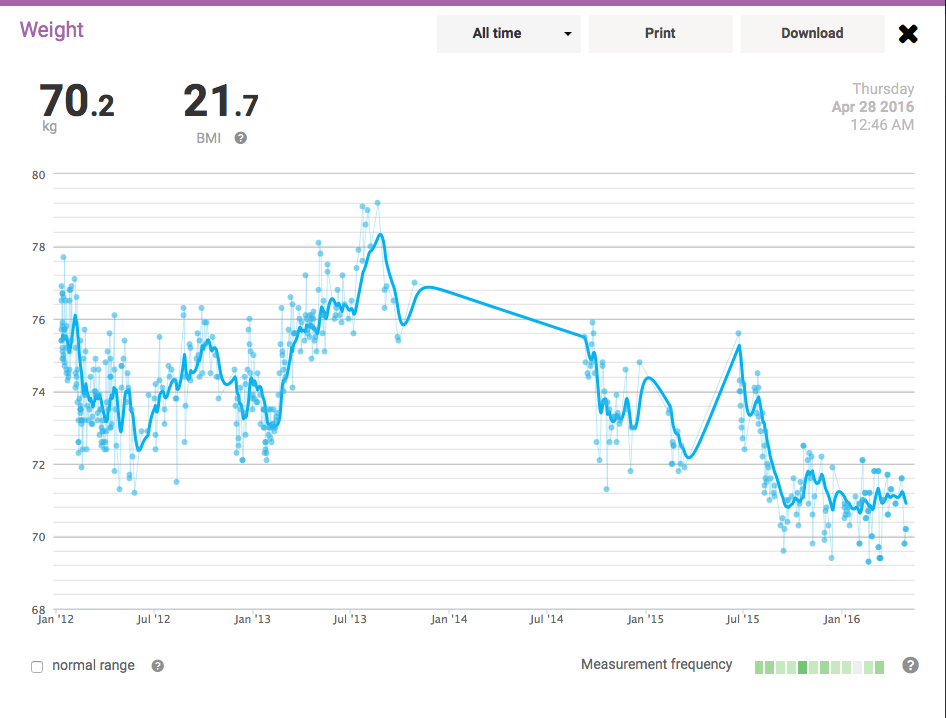
withings_weight.png
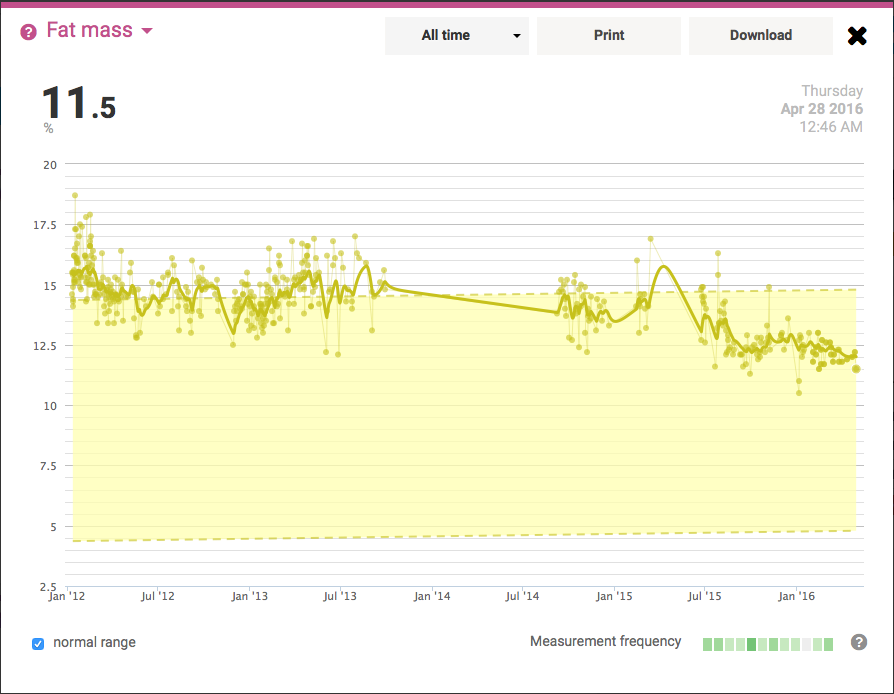
withings_fat.png
On Runkeeper, I can only see weight and running graphed together for periods of around 10 months or less. Otherwise I have to choose between seeing daily weight measurements but no running at all, or weekly or monthly running averages but no weights. So, I can’t graph them together essentially. (I’ve tried Firefox and Chrome over the years.)
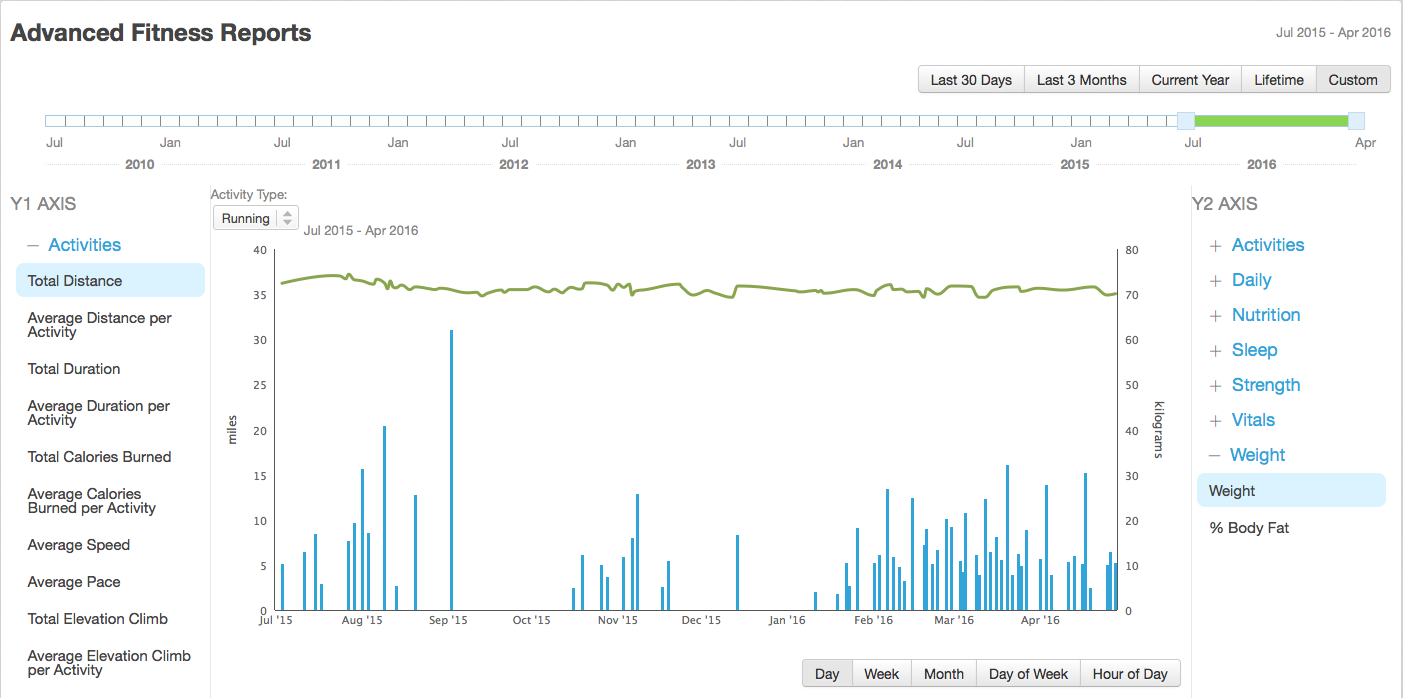
runkeeper_201507-201604.png
July 2015 to April 2016 works fine. But when I try to include one more month, it breaks:
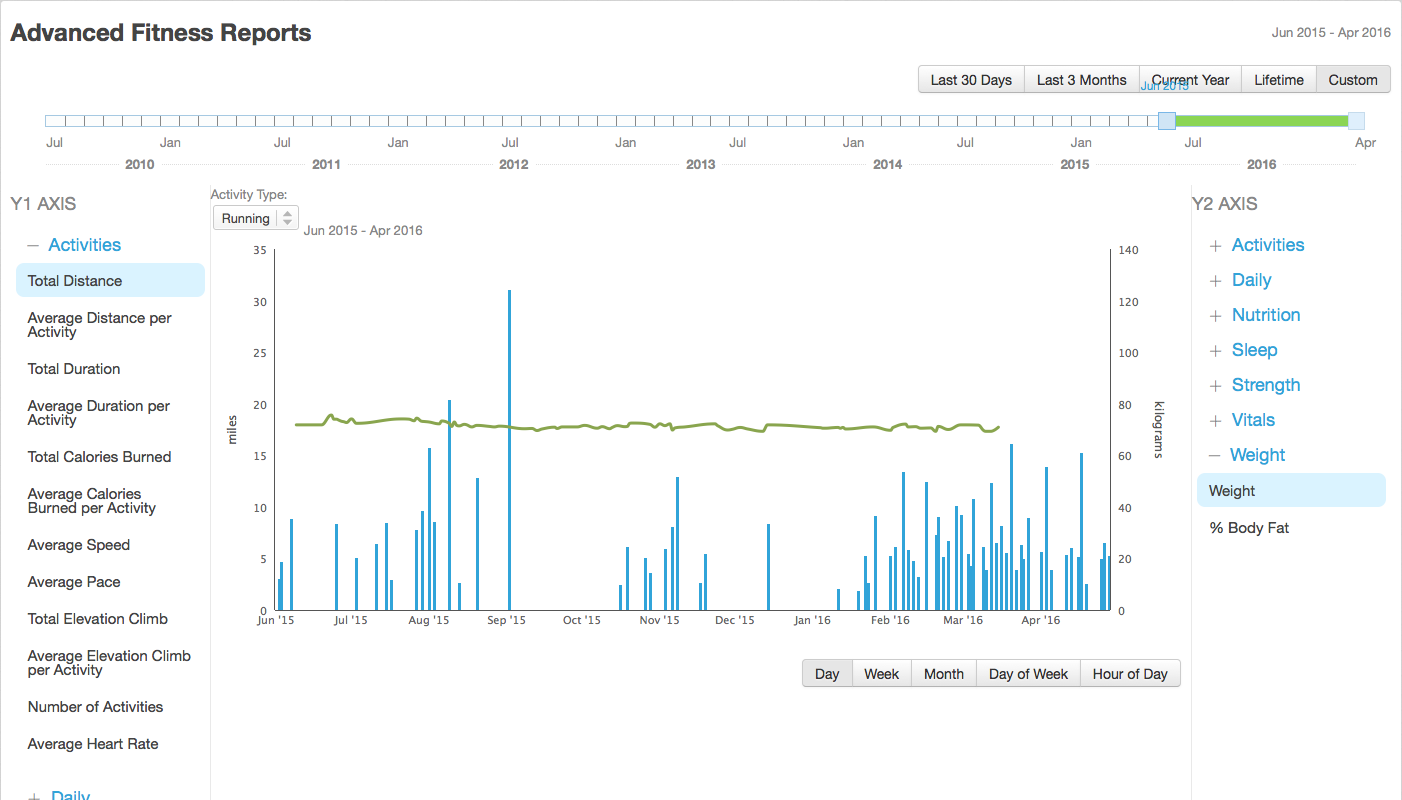
runkeeper_201506-201604.png
Removing a recent month, yielding June 2015 to March 2016, still doesn’t work fully, despite being the same number of months as the one that worked:
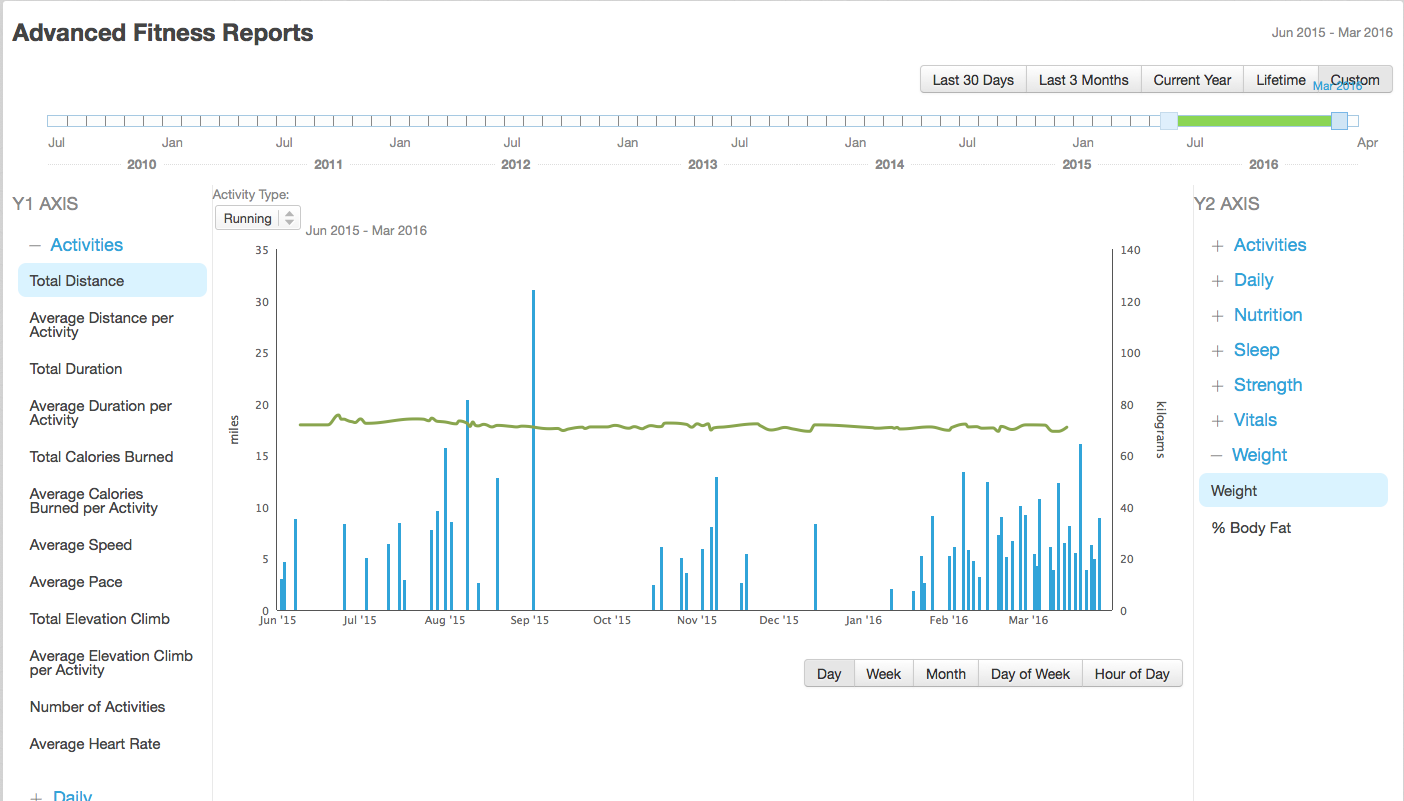
runkeeper_201506-201603.png
But subtracting one more recent month, for June 2015 to February 2016, makes it work again:
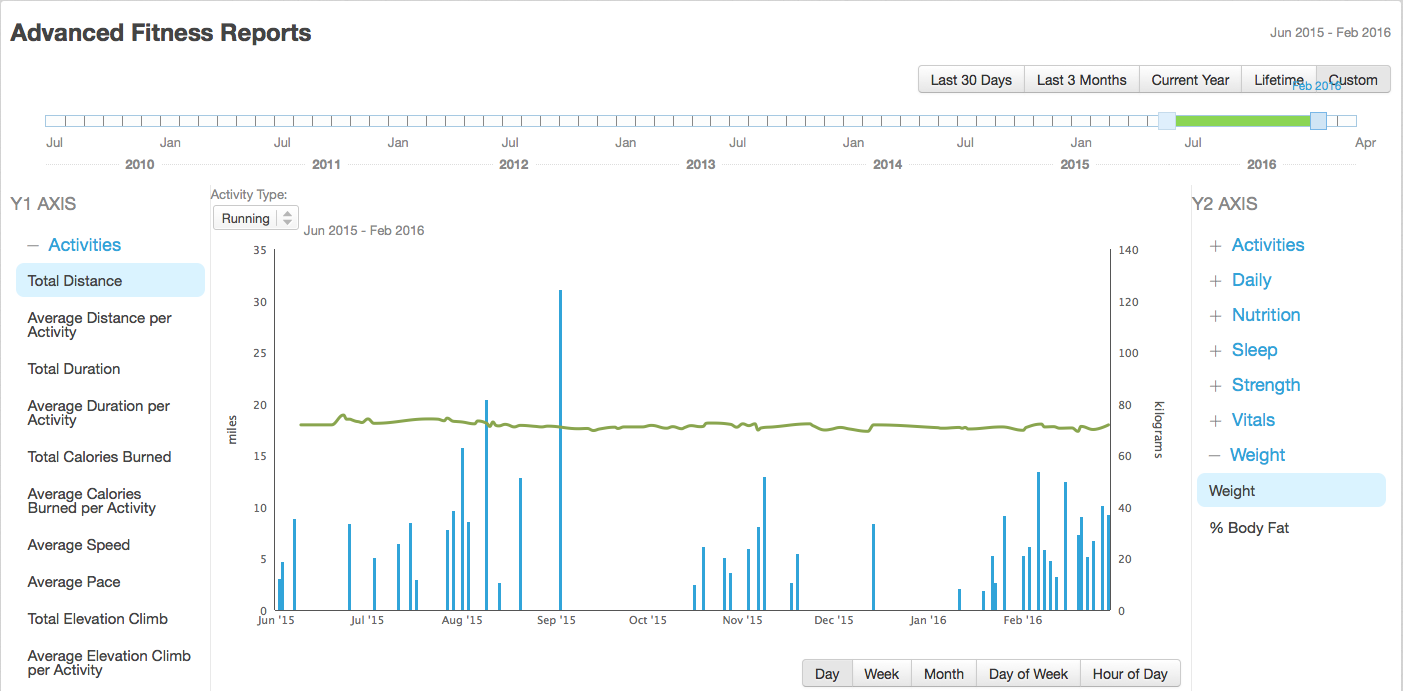
runkeeper_201506-201602.png
When I check the JavaScript console, I see a bunch of the same error message when I view the “day” data, but it doesn’t show up when the weight data is broken, when I am viewing the “week” or “month” data, so I am assuming it’s not the cause:
14:07:33.540 Highcharts error #12: www.highcharts.com/errors/12 highcharts_3.js:14:280
That URL shows:
Highcharts Error #12
Highcharts expects point configuration to be numbers or arrays in turbo mode
This error occurs if the
series.dataoption contains object configurations and the number of points exceeds theturboThreshold. It can be fixed by either setting theturboThresholdoption to a higher value, or changing your point configurations to numbers or arrays. SeeturboThreshold.