Weatherbit: Discover how weather affects your activity level
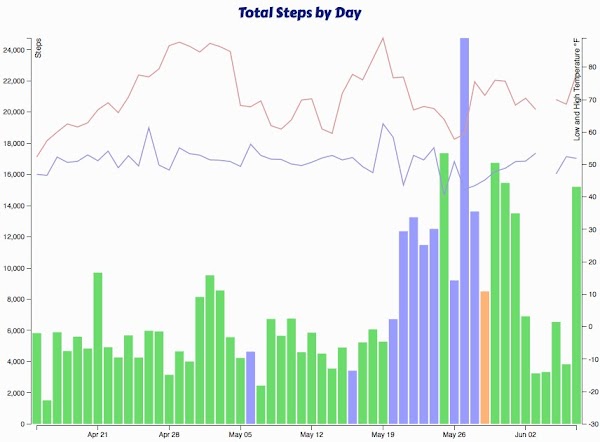
I don’t remember exactly how I came up with this idea, but when I was looking at some D3.js powered charts, I decided to make something so I could play with them. Somehow I chose to try pulling my daily step counts through the Fitbit API and graphing it against temperature data. I found a neat weather data API, Forecast.io, and used my Foursquare history to determine which location to use for weather data each day. Once I got this working, I created a web page so others can create their own graphs. And I called it Weatherbit.
I thought it would be interesting if bad weather lead to decreased daily activity, though it doesn’t really seem to be the case for me. But my example above includes a trip to Europe where I had to do a lot of walking. Anyway, check out Weatherbit if you’re interested!


